
Large brain imaging studies are analyzed by averaging the brain volumes of thousands of participants. However, a new study demonstrates that these findings may not apply to everyone. The research, led by Kaja Z. LeWinn at the University of California, finds that if demographic factors are accounted for, the studies show vastly different results. The researchers call this biased sampling, and it pervades the brain imaging research.
Much of the research in this field is conducted on participants who are White city-dwellers, who are well-educated, and who have a high socioeconomic status. LeWinn and her colleagues suggest that future studies need to include a sample that is more representative of the US population.
 According to LeWinn, “To date, there are no neuroimaging studies based on a representative sample of the U.S. population.” Because of this lack, conclusions about brain development may not be valid for people whose demographics are not represented in the current research.
LeWinn’s study was published online this month in Nature Communications. The findings suggest that childhood brain development occurs differently and at different ages depending on environmental factors.
The authors analyzed a large dataset using two different methods—one that accounted for demographic factors, and one that did not. They found a very different picture of brain development when accounting for demographic factors in their second analysis.
According to the authors, “Our findings empirically demonstrate observable impacts of sample composition on cognitive neuroscience findings, even for questions about fundamental processes such as age-related change in neural structure.”
That is, many people assume that brain development throughout childhood follows a known, universal pattern. However, this study demonstrates that demographic factors may substantially alter the pattern of “normal” brain development.
LeWinn and the other researchers performed the two analyses to demonstrate that demographic factors have an impact on the results from brain imaging studies. They analyzed data from a large, publicly available collection of well-conducted brain imaging results (called the PING dataset). The sample used by the authors contains 1,162 children ranging in age from 3 to 18. Although the participants were from a variety of racial and socioeconomic backgrounds, the sample did not accurately represent the US population. Specifically, the dataset includes far more Hispanic and multi-racial participants, and wealthier, more educated families, than the general US population.
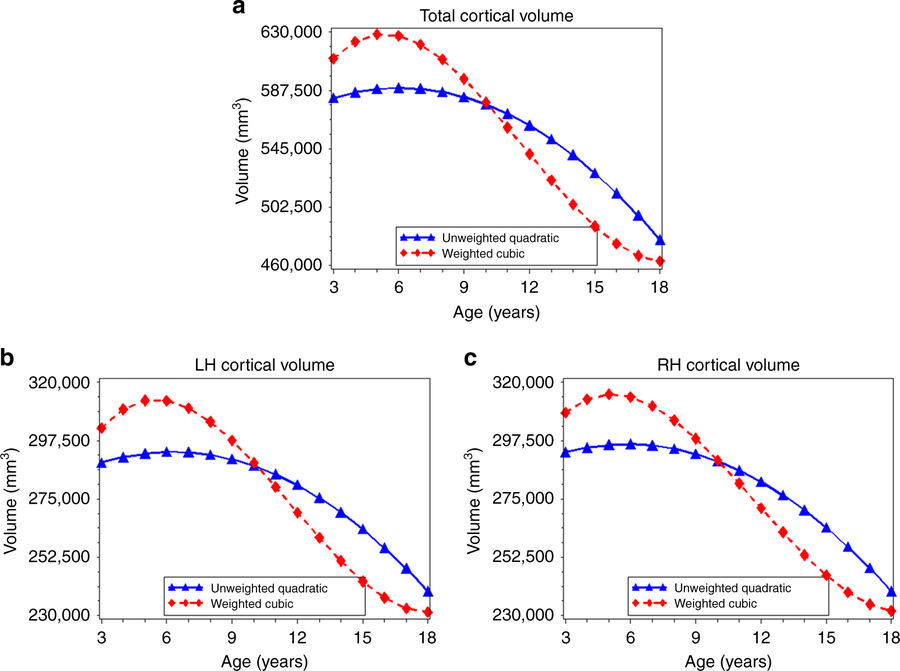
In both analyses, the authors determined average brain volumes at different ages (for both the whole brain and for specific areas) and used an algorithm to fit a curved line to the data. The difference is that in the second analysis, the authors weighted the sample so that it was more representative of the US population. That is, they increased the amount that White, poor, and less educated Americans would factor into the data.
The standard analysis of the data found that, on average, brain volume increases slightly at young ages, then begins decreasing slightly before decreasing at a greater rate around age 9. However, the weighted data resulted in a very different shape. On average, brain volume began higher and had a much steeper initial climb to an earlier peak (before age 6), then a very steep decrease.
So which of the two reveals the “normal” development of the brain? To which should we compare our children’s brains?
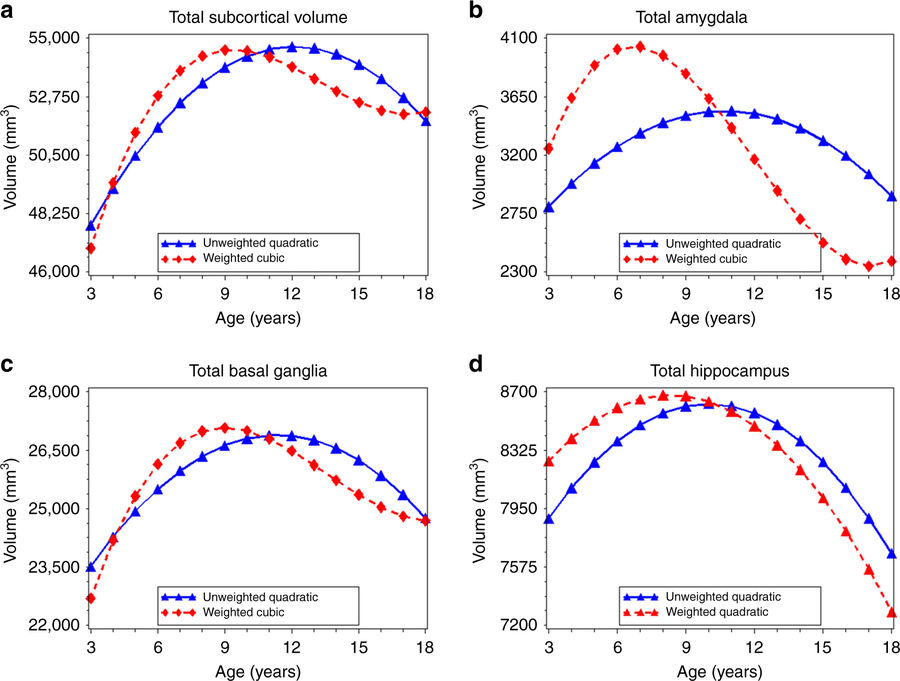
The authors write that they are unable to answer that question. Their purpose, they write, was to demonstrate that “average” brain development looks very different when demographic factors are included. The authors suggest that the stresses of poverty account for much of the difference: normal brain development for children in such situations may peak earlier, and certain brain regions may develop before others. For instance, the development of the amygdala (the brain region associated with emotional processing) over time looks very different in this new analysis:
The results of this analysis suggest that an average brain development trajectory may not be generalizable across different demographics. Even if the demographics of the sample match those of the US, an average of very different brain development trajectories may not accurately reflect individual brain development. In addition, LeWinn suggests that researchers be aware of other factors that might affect brain development, including birth weight, exposure to prenatal toxins, and exposure to traumatic violence.
****
LeWinn, K. Z., Sheridan, M. A., Keyes, K. M., Hamilton, A., & McLaughlin, K. A. (2017). Sample composition alters associations between age and brain structure. Nature Communications, 8. Article Number 874. doi:10.1038/s41467-017-00908-7 (Link)


Do they test for lead? “Children suffer from lead poisoning in 3,000 U.S. neighborhoods” https://www.cbsnews.com/news/lead-poisoning-children-neighborhoods-us-flint-michigan/
Report comment
If we imagine the pre and post synaptic neuron as two people sitting in a living room with a window, and all of a sudden a gas canister of tear gas, comes smashing through the window, it’s a shock, obviously we have to do something, we can’t live in that environment, have to move, to change, to get the gas out, open the doors, open more windows, turn on fans. But what happens if that gas canister keeps coming through the window every single day ? It would be intolerable.. we would board up the windows. When you walk past boarded up buildings, well they are essentially dead, no one is working or living there. Is that what happens in the brain when you keep on pumping in stuff that should not be there, that is not part of evolution? Does the body narrow the tiny blood vessels in an attempt to deal with this unacceptable situation, causing cell death to white matter hyper intensities and to eventual vascular dementia ?
Report comment
When is someone going to conduct a brain imaging study on the brains of researcher who study brain imaging? I want proof that these people actually have brains.
Report comment
I feel as though computing averages and then fitting a random polynomial curve is really spurious. This would only make sense if the distribution of brain volumes amongst the whole sample is a symmetric normal. My guess is that the data tell a vastly different story, even within specific demographics.
Brain research needs to be held to an extremely high standard of methodology and modeling assumptions, because if a “normal” brain is defined in a biased way, the consequences will be devastating.
Report comment
It is interesting that they talk about “differing demographics impacting imaging results” or some such, but overlook the more important conclusion: BRAIN DEVELOPMENT IS MASSIVELY IMPACTED BY ENVIRONMENT! This kind of research should immediately put any speculation about “brain illnesses” explaining “mental health issues” to rest, but of course, the authors don’t even notice this very important issue and focus instead on “sampling problems.” It shows how biased and unbending the medical model worldview really is.
Report comment
While we’re on the subject does anyone have the goods on this shrink/hustler Daniel Amen (“On The Psychiatrist’s Couch”) on PBS who’s always pushing his “brain scans”?
Report comment